The Mother of All Lens Tests
Contents
The Event
Objective Testing
MTF--What Does it Mean?
Results
Contrast
Resolution
Average
Performance by Type
Variability
Comparison of
Eastern-Bloc Lenses with Western High-End Lenses
Subjective Testing (under construction)
The Event
Photographers fall into two camps: Those who don’t care about equipment, and those who do. Fortunately, good photographers and even artists can be found in both camps, despite the natural suspicion the first group has for the second, and the general disdain the second group has for the first. Collectors invariably find themselves in the second group. Engineers who collect might as well be imprisoned there, but it is a prison of their (our) own choosing.
Four fellow prisoners gathered together one unusually mild December day in New Jersey. Statements had been made: The Flektogon wide angle lenses are excellent. The Flektogons are junk. Hands were dealt, bets made, and the call was issued. It was time to turn over the cards.
Thus, we four gathered our various collections together, yielding a test collection of 48 lenses, the likes of which may have never been assembled in one place. We had no fewer than seven 50mm/4 Flektogons, five 65mm/2.8 Flektogons, and six 180mm/2.8 Sonnars in Pentacon Six mount. As various forms of control, we added a range of other lenses, including a variety of Ukrainian lenses made by Arsenal for the Pentacon Six mount, plus a range of high-end Zeiss Oberkochen lenses for the Hasselblad and Schneider Kreuznach lenses for the Exakta 66 to act as controls.
Eschewing food, shelter, and even a place to sit, we used up the daylight photographing a test chart, burning through about a dozen rolls of film. But that was the easy part. Then came the task of stripping all the transparencies and marking them as to their source lens so that the images could be matched to the database, and the much more tedious task of looking at each image under 30 and 100-power microscopes to evaluate the test charts.
The result? A few trends bubbled up, documented in the article that follows:
- Expensive lenses are better than cheap lenses, particularly in the corner of the frame.
- The high-end short telephotos in the test outperformed the vaunted CZJ Sonnars, particularly in the corners.
- Hartblei lenses are not necessarily any better than the Arsenal lenses on which they are based (though the mechanics are certainly better, of course).
- Flektogon 50mm lenses are superb in the center and not in the corners.
- Flektogon 65mm lenses deserved to be discontinued.
- The Arsenal 65mm lenses really aren’t much better than the Flektogons.
- If you want a moderate wide, spring for the Curtagon.
- Production year showed no relationship with performance in the test.
- Multicoating does not affect contrast and resolution in the test.
- The lowly Mir 26 is a better and more consistent performer than its reputation would suggest.
- More money generally buys better corner performance.
- High-end lenses generally performed better at MTF 10% compared with the second-world lenses. Stated another way, the soviet-sphere lenses were often the better performers in apparent sharpness--MTF 50% resolution--than the western lenses, at least in the center of the frame. It would appear that high-end lenses are optimized for absolute resolution, while older lenses were optimized for contrast and apparent sharpness.
- More money generally buys more ultimate resolving power, but not necessarily better apparent sharpness, at least in the center of the frame.
- How well a lens can produce details to a level of 50% of the original contrast tells more about the lens than ultimate resolving power. All the lenses in the test were, at least in the center, good performers at this level.
- Expensive cameras have more accurate shutters than cheap cameras
- Mishaps will occur
Why This Test?
Why not?
Actually, the point of the test is to consider several questions previously unreachable in tests of single samples, including the tests elsewhere on this site. The objective of the test was to:
- Characterize, if possible, sample variation in Flektogon lenses in particular and Carl Zeiss Jena lenses in particular
- Compare Second World and First World optics
- Answer the question: Are Arsenal lenses, with their known quality control problems, more variable than Carl Zeiss Jena offerings?
- Squirt some oil in a range of old Pentacons
An extremely important point is that this test is NOT intended to determine which lenses are usable or not. Every single lens in the test has proven effective in making quality images. Let me say that again:
Every lens in the test is a proven performer.
A lens that performs poorly in the corners can still be quite effective when used with central subjects, and a lens that isn’t quite as sharp as another lens might still be more useful if it is faster or if its rendering is prettier. This test is narrow and technical, with no artistic recommendations to be made at all.
But there is a subtler aspect to the above statement. This is NOT a test of manufacturing variability. All the unacceptable performers have been filtered out of the test by virtue that their owners didn’t bring them (if indeed they still owned them). Thus, this isn’t a test of the variability of Mirs, but a test of the variability of usably good Mirs. Thus, this test does not constitute a risk analysis of buying an unknown lens. All the warnings about buying some lenses from sources that allow a return, or for cheaply enough to manage the risk, still apply.
Lens Database
The lens database in shown in Table 1.
|
Lens |
Serial No. |
Comment |
Year Made |
|
Hartblei PCS 45/3.5 |
0055 |
with Pentax shade |
2000 |
|
Hartblei PCS 45/3.5 |
00148 |
with Pentax shade |
2000 |
|
Arsenal Mir-26 45/3.5 |
832517 |
|
1983 |
|
Arsenal Mir-26 45/3.5 |
921284 |
|
1992 |
|
CZJ Flektogon 50/4 |
9860692 |
Enameled black (Type IV), multicoated, not marked MC |
1976 |
|
CZJ MC Flektogon 50/4 |
6325 |
Type IV MC |
1985 |
|
CZJ Flektogon 50/4 |
9859253 |
Type IV, not multicoated, not marked MC |
1976 |
|
CZJ Flektogon 50/4 |
9065540 |
Zebra (Type III) |
1971 |
|
CZJ Flektogon 50/4 |
9853279 |
Zebra (Type III) |
1975 |
|
CZJ Flektogon 50/4 |
9125623 |
Zebra (Type III) |
1973 |
|
CZJ Flektogon 50/4 |
8969236 |
Zebra (Type III) |
1971 |
|
Zeiss T* Distagon 50/4 |
7433589 |
FLE for Hasselblad |
|
|
Zeiss T* Distagon 50/2.8 |
6759222 |
FLE for Hasselblad |
|
|
CZJ Flektogon 65/2.8 |
7316191 |
Zebra (Type III) |
1967 |
|
CZJ Flektogon 65/2.8 |
7316382 |
Type II |
1967 |
|
CZJ Flektogon 65/2.8 |
5550115 |
Type I |
1958 |
|
CZJ Flektogon 65/2.8 |
7315600 |
Zebra (Type III) |
1967 |
|
CZJ Flektogon 65/2.8 |
6372727 |
Type 1 MC'd by Hartblei |
1961 |
|
Hartblei 65/3.5 |
0020 |
|
2004 |
|
Arsenal Mir-38 65/3.5 |
860780 |
|
1986 |
|
Hartblei PCS 65/3.5 |
0046 |
for Hasseblad mount |
2000 |
|
Arsenal Mir-3 65/3.5 |
See Comment |
Dan's sticker covers serial number |
|
|
Zeiss T* Distagon 60/3.5 |
7393716 |
CF for Hasselblad |
|
|
Arsenal Arsat PCS 55/4.5 |
00915 |
|
2001 |
|
Schneider Curtagon 60/3.5 |
14180083 |
for Exakta 66 |
1986 |
|
Schneider Xenotar 80/2.8 |
14203884 |
for Exakta 66 |
1986 |
|
Exakta Biometar III 80/2.8 |
48394 |
Exakta 66 trim |
1990 |
|
CZJ MC Biometar 80/2.8 |
15876 |
|
1983 |
|
CZJ Biometar 80/2.8 |
8569883 |
Zebra (Type III) |
1970 |
|
Arsenal Arsat 80/2.8 |
9501809 |
|
1995 |
|
Arsenal Volna 80/2.8 |
9300129 |
|
1993 |
|
Zeiss T* Planar 80/2.8 |
7137270 |
CF for Hasselblad |
|
|
Arsenal Vega 90/2.8 |
807976 |
|
1980 |
|
Hartblei 150/2.8 |
0005 |
|
2003 |
|
Arsenal Kaleinar 150/2.8 |
910883 |
|
1991 |
|
Schneider Tele-Xenar 150/4 |
14146224 |
for Exakta 66 |
1985 |
|
Zeiss T* Sonnar 150/4 |
7551542 |
CF for Hasselblad |
|
|
Zeiss T* Sonnar 150/4 |
6918740 |
CF for Hasselblad |
|
|
Zeiss T* Sonnar 150/2.8 |
5882471 |
F for Hasselblad 2000 |
1975 |
|
Zeiss T* Sonnar 180/4 |
7949528 |
CF for Hasselblad |
|
|
CZJ Sonnar 180/2.8 |
9146514 |
Zebra (Type III) |
1972 |
|
CZJ MC Sonnar 180/2.8 |
10161869 |
with Hasseblad compendium shade |
1978 |
|
CZJ MC Sonnar 180/2.8 |
3147 |
With custom shade |
1983 |
|
CZJ Sonnar 180/2.8 |
6256251 |
Type 1, MC'd by Hartblei |
1961 |
|
CZJ MC Sonnar 180/2.8 |
13430 |
Type IV |
1987 |
|
CZJ Sonnar 180/2.8 |
8597220 |
Zebra (Type III), with custom 'blad mount |
1970 |
|
CZJ Sonnar Preset 180/2.8 |
4830400 |
custom 'blad mount |
1956 |
|
CZJ Sonnar Preset 180/2.8 |
3273206 |
custom 'blad mount |
1949 |
|
Meyer 180/4 |
xxx381 |
|
|
Table 1. Lenses Tested.
Most of the Arsenal and Hartblei lenses were based on optics formulated in the 1960’s or 1970’s, and are thus newer than the formulations used by Carl Zeiss Jena. But the construction quality of the Arsenal lenses is generally thought to be poor.
The design and formulation of the Carl Zeiss Jena lenses took place following World War II, as follows:
- 1956 for the Biometar, with is a five-element double-gauss lens of the Planar type. The Biometar III in the test was reformulated in 1979. but all Biometar 80mm lenses produced until 1989, and up to serial number 40,000, used the 1956 formulation. The Biometar III serial number does not appear in the Jena records up to 1991, but it may be that the optical elements were provided to Joseph Schneider who probably produced all the lenses in Exakta 66 trim. Thus, there is no assembly card in the Zeiss Jena records.
- 1950 for the Flektogon 65mm f/2.8 retrofocus wide angle lens. The Flektogon design was one of the first retrofocus wide angle designs, coming out at about the same time as the Angenieux Retrofocus which is widely accredited with being the first. The retrofocus design allows the lens elements to be placed in front of the optical center of the lens, so that lenses with short focal lengths can clear the reflex viewing mirror in single-lens reflex cameras. The Practisix (later the Pentacon Six and ultimately the Exakta 66) was one of the first mass-produced medium-format SLR’s, and thus CZJ, as the main supplier of lenses for the Praktisix, was motivated to formulate retrofocus wide angle designs.
- 1958 for the Flektogon 50mm f/4 lens, with that formulation being revised in 1966. All the lenses in the test were of the later reformulated design.
- 1949 for the Sonnar 180mm f/2.8, with reformulations in 1959 and again in 1966. In the test, all but one of the lenses was from the 1966 formulation. There were two 180mm f/2.8 Sonnars originally produced for the Exakta 35mm camera that were adapted for use on the Pentacon Six mount. One dates from the original year of the Sonnar 180/2.8 design in 1949, and the other dates from 1956. Both were of the 1949 design, though the barrels differed significantly. The Sonnar design is much older, and it is really a design for a normal lens. By using very thick elements, the Sonnar could minimize air surfaces and still provide a high-quality very fast lens, and the first fast normals (f/1.5) for 35mm Contax cameras were Sonnars. When lens coatings made more air surfaces possible, the Planar design won out for normal lenses because it provided enough clearance for a reflex mirror, which the Sonnar design did not. But the Sonnar lives on as a short telephoto lens, known for high speed and beautiful rendering of out-of-focus areas.
Carl Zeiss built lenses at the Jena factory since the late 1800’s, but after World War II, Jena found itself in the Soviet sphere. A number of Zeiss technicians and scientists escaped (with American help) into the west, forming a company that would eventually become known as Carl Zeiss, with production facilities in Oberkochen, (West) Germany. Carl Zeiss Jena continued to produce lenses, and the two companies warred over who would be able to use the Carl Zeiss label. In the end, they both did, at least in some places. After the unification of Germany following the end of the Cold War, the two Zeisses merged once again, but lens production in Jena stopped in 1991.
The Zeiss Oberkochen lenses in the test were not dated, but are of relatively recent design and most are still current models. All had the T* coating and several had floating elements.
Production and formulation years for the Carl Zeiss Jena lenses were taken from the production cards issued to the technicians who did the lens assembly, as documented by Hartmut Thiele in Fabrikationsbuch Photooptik II—Carl Zeiss Jena.
Production years for Arsenal lenses were taken from the serial numbers. Production years for Hartblei lenses were estimated from when the lenses were made available to their owners, most of whom bought them new or from their original owners.
The Tests
Two approaches were used to evaluate lenses. The first was to specifically, and as objectively and quantitatively as possible, evaluate the performance of the lenses using a formal testing method. The second was to make images of a common scene with a selection of images to serve as the basis for subjective comparisons.
Objective Testing
The method used for this test was as outlined by Norman Koren in his online article on lens testing. He provided test charts that could be printed and arranged on a presentation board to serve as a test target.
A complete discussion of the chart and how it is used is on his web site, here.
The board was 56 inches wide and 30 inches tall, and the camera was positioned such that the right edge of the board was in the center of the frame and the left edge at the edge. Thus, the cameras were positioned to focus on an area about ten feet wide. Distance to the chart range from about 8 feet for 45mm lenses to about 31 feet for 180mm lenses. The test chart was designed to be five millimeters wide on the film, requiring a 50:1 reduction from the chart, which printed to about 10” wide.
The test chart was marked, using sticky notes, with the last three digits of the serial number and the aperture of the lens. Exposures were also carefully noted as the exposures were made, so the marking on the film served as a backup.
The chart was placed in full sun, and this proved to be a problem. With the Fuji Velvia film used, it was impossible to achieve f/2.8 during some of the testing because conditions were too bright. Thus, the Sonnars were tested at f/4. The 65mm Flektogons were tested at f/2.8, however, and, coupled with shutter accuracy concerns on the test camera, resulted in overexposure. This may have affected the interpretation of the results in the center.
The test camera was an early Hanimex Praktica 66 that had been recently, extensively and carefully reworked and had proved itself in recent and considerable field use. The full sun, however, required a shutter speed of 1/1000, and this speed is a problem on most medium-format cameras with mechanically regulated focal-plane shutters. The Exakta 66 Model III that had been originally proposed for the test demonstrated a frame counting issue on test day. Based on my prior shutter tests, I should have used the 2001-model Kiev 60, which has an accurate 1/1000 shutter speed (and all the others are accurate, too), but even better would have been the Pentax 645 with its electronically regulated shutter.
In future tests, the preferred approach would be to light the test chart with studio strobes instead of regulating the exposure with the shutter. I had the equipment available to do so at the test, but held it in reserve for foul weather. Live and learn.
Test Protocol
(In this article, lines/mm should always be interpreted as line pairs/mm).
The test attempted to identify the critical resolution of the lens at two levels of contrast, denoted by the Modulation Transfer Function. This is the opposite of how most MTF tests are done. With optical bench testing equipment (designed and invented by Carl Zeiss Oberkochen), The MTF at various distances from the center of the frame are measured against known spatial frequencies of line pairs. So, they find out the accuracy of the transmission of line pairs at, say, 40 lines/mm, 20 lines/mm, and 10 lines/mm.
In this test, done without bench testing equipment, we used Norman Koren’s charts. These charts provide a range of spatial frequencies from 5 to 200 lines/mm, with comparison strips at MTF of 50% and MTF of 10%. Thus, we found the highest spatial frequency that could achieve an MTF of 50% and 10%. Since most MTF tests provide MTF values of 70-90% at low spatial frequencies, our results are not immediately comparable to published results. This does not diminish the value of our approach.
Each lens was mounted and focused at full aperture, with the focus objective being to be able to resolve as many of the lines in the target near the center as possible. This is a critical focusing method that is more accurate than split prisms or microprisms.
Each lens was tested at maximum aperture (except for the Sonnars, which were tested at f/4), and at f/8. F/8 was selected because any good lens should be performing excellently by f/8, but the aperture isn’t small enough to mask lens deficiencies or create visible diffraction.
MTF—What Does It Mean?
MTF stands for Modulation Transfer Function. It is, simply, how much of the original test chart makes it to the film. Rather than use hard-edged bars and spaces as with, say, the popular USAF test chart, a proper MTF test uses a density wave varying from black to white according to a sine wave. As the dark bands get closer together, the aberrations of the lens smear them into the white areas between the lines. The dark bars are thus diluted by the white areas, and the white areas are soiled by the dark areas. When the difference between black and white, which is near 100% on the target, reaches only 50%, then that frequency is the critical lens resolution at MTF 50%.
Contrast—MTF 50%
Most lens tests are conducted using some variation on the popular USAF lens test chart sold by Edmund Scientific and others. Most testers report a successful test if they can just make out the line pairs on the test chart when inspecting the film under a microscope. This is how the other lens tests on this site were conducted. In practice, though, a lens’s ability to produce line pairs that can just be made out is a fairly low standard, and one that does not correspond to the perceived sharpness of a lens very well.
Measuring critical resolution at MTF 50% is a standard much closer to what viewers will or won’t perceive as sharp rendering.
To explain the value of measuring critical resolution at MTF 50%, let’s work back from a print. At close focus, most adults who don’t yet need bifocals can clearly resolve about five lines/mm with the naked eye. Proper viewing distance of a print, however, is when the print subtends an angle of about 45 degrees to the viewer. Thus, proper viewing distance for an 11x14 print is about 17 inches. This is about twice as far away as minimum inspection distance.
Taken at proper viewing distance, most viewers can therefore clearly resolve perhaps two or three lines/mm on the print with the naked eye. Achieving a print of that size requires a 7x enlargement from a medium-format frame, so the film must be able to record about 15 or 20 lines/mm to be perceived as sharp on a print of that size.
But viewers define “sharp” as seeing a contrasty edge between light and dark. It is possible for a lens to have high resolving power without appearing to be that sharp, if the edges are faded as a result of reduced contrast. Thus, an MTF of 50% becomes a standard of the contrast needed to produce apparent sharpness in a print of moderate size viewed normally. And an MTF 50% critical resolution of 15 or 20 lines/mm will produce prints of 7x enlargement (11x14 for medium format) that will appear to be sharp when inspected from proper viewing distance. Critical resolution of 35 lines/mm at MTF 50% is enough to provide apparent sharpness even when inspected closely by adults with good vision.
But the numbers from this test always look awful compared to resolution numbers we are accustomed to seeing. Keeping this fact in mind will make it easier to tolerate:
The reported resolution of Fuji Velvia at MTF 50% is 37 line pairs/mm.
In the test, we measured no MTF 50% resolutions higher than that, so nothing in our test challenges the above statement. But given that Velvia is the film used when absolute image quality is the goal, the above statement should give some context to MTF 50% resolution values. Anything on the same planet as 30-40 lines/mm at MTF 50% is as good as it gets. Anything above 15 is probably mighty fine.
Resolution—MTF 10%
As mentioned above, most testers who evaluate test charts look for the minimum threshold of visibility. This corresponds to a variation in light and dark of about 10%. Thus, the MTF 10% critical values presented in this test are reasonably comparable to most published lens resolution values, including those in the lens tests elsewhere on this site.
Norman Koren’s Lens Test Chart
The Koren chart was described previously, but another few items are worth noting. One is that the test chart is presented such that an MTF 50% sample strip is provided on the chart (at about 10 lines/mm spatial resolution) for comparing against the line pairs at the critical frequency. This makes it possible for the comparison to be made even when the density of the chart varies from the ideal. Because of exposure variations, this feature was critically important.
Even so, some images showed a complete loss of visibility of the test lines. This was apparently caused by overexposure, and in particular affected the wide-open results with the 65mm/2.8 lenses. Thus, those results may be reported herein as worse than they really should be. The notion that the test chart is readable over a range of densities is theoretical and was not tested explicitly.
Also, for many lenses the labeling on the test chart was not readable on the film. As a result, I compared the position of the critical line pairs with other landmarks on the test chart.
It should be noted also that the test chart is expected to be 5mm on the film. In all cases of the test, it was about 85% of that value, because the camera was positioned based on the frame edges shown by the focus screen, which only shows about 85% of the full frame on the test camera.
Because of the variability in densities and the subtlety of doing MTF comparisons, results are not expected to be more accurate than perhaps 20% one way or the other, taken on a logarithmic scale.
Results
The results of the test have been evaluated in a variety of ways, and may be further evaluated as discussions about the results emerge. Primarily, all lenses were evaluated for contrast (MTF 50% critical resolution) and resolution (MTF 10% critical resolution), near the center of the image and at the corner, with the aperture wide open and set to f/8.
Gaps in the charts are the results of mishaps. In this test, the most common mishap was overlapped images. One roll was apparently misloaded (I was the one who loaded that roll), causing overlapped frames. Also the Hartblei back, which was supposed to be Hasselblad compatible, overlapped frames when used on a Hasselblad.
Contrast
Figure 1 shows contrast at f/8, and this portion of the test more than any other describes the apparent sharpness of the lens in practical use. Contrast is the critical resolution, in lines/mm, at a modulation transfer of 50%. The blue bars in the chart were taken from the test chart near the center of the frame, and the purple bars were taken from the test chart near the corner of the frame. The bars are arranged in increasing focal length, with the 45 lenses at left and the 180mm lenses at right. Some trends emerge immediately:
- Strong wide angle lenses of older designs consistently perform much better in the center than in the corners with lenses in the test.
- Newer strong wides, such as the Zeiss Distagon 50mm f/4 and the 60mm Distagon and Curtagon were far more even across the frame.
- The western Zeiss Sonnars and the Schneider Tele-Xenar were noticeably better performers than the Jena Sonnars.
- The Mirs were really good in this test, suggesting that even when ultimate resolution (see below) is a little lower, they still produce images that appear to be crisp. This fits with the reputation for these lenses of being better than their usual test results.
- The Jena Biometars were consistently good performers, even compared to a Zeiss Planar.
- All the lenses in the test, with the except of the corner performance of the 50mm and 65mm Flektogons, were good enough to make a sharp-appearing 11x14 print viewed from normal viewing distance.
- The soviet-sphere strong wide angles were superb in the center of the frame, in many cases pushing the boundaries of the film. The high-end telephoto lenses from Schneider and Zeiss Oberkochen also pushed the capabilities of the film.
- The Schneider Xenotar (or the Zeiss Planar, for that matter) was not noticeably better than the Jena Biometars.
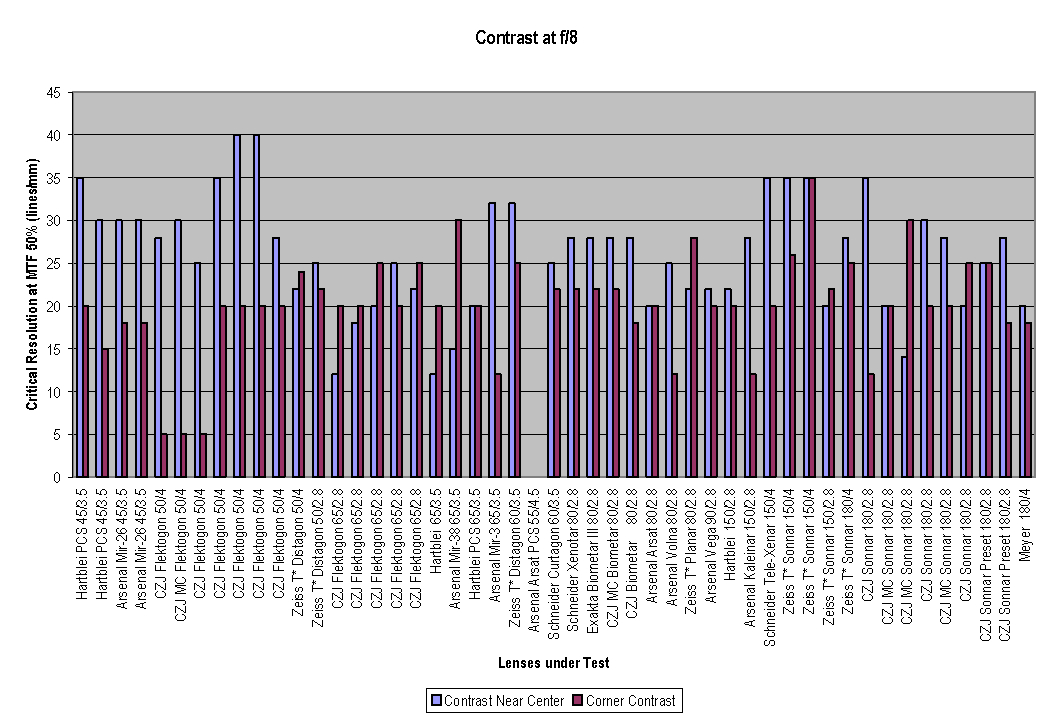
Figure 1. Contrast: Critical Resolution at MTF 50%, f/8.
The wide-open test was little more demanding, of course. Figure 2 shows contrast results at maximum aperture. Wide open, a couple of the 50mm Flektogons could not produce MTF 50% at any resolution, yet others were strong performers. The 65mm lenses showed stronger performance in the corners than in the center, but this is likely an artifact of overexposure, where the corners benefited from vignetting. Wide open, the Jena Sonnars were a little more comparable to the high-end telephotos, which is where their reputation is strongest. Many of the lenses did not exhibit good enough contrast to make a sharp-appearing 11x14 when used wide open.
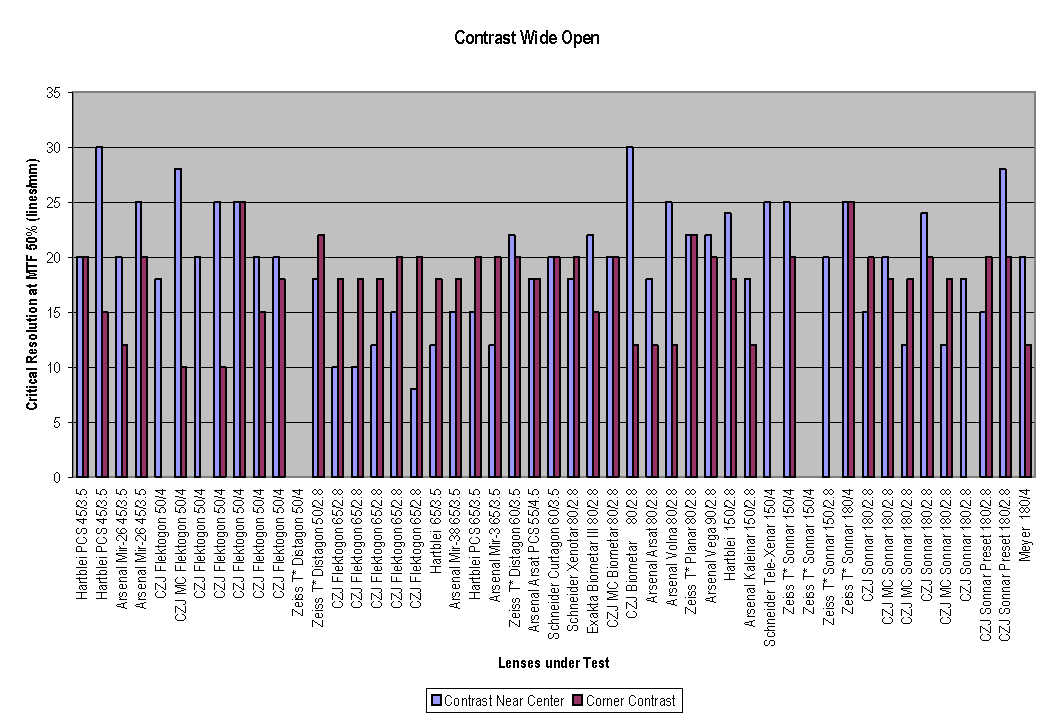
Figure 2. Contrast: Critical Resolution at MTF 50%, Near Maximum Aperture.
Resolution
As previously described, resolution is the just-discernable variation in line pairs, corresponding to an MTF of 10%. Figure 3 shows resolution at f/8, which might also be thought ultimate resolving power. These results should be similar to most test-chart results that are published. Some highlights of the results include:
- The strong wide angle lenses were still much better in the center than in the corners. Some 45 and 50mm wides were unable to perform much better than at MTF 50%.
- The Mir 26 45mm lenses generally out-performed the Flektogons, though both groups were excellent in the center of the frame.
- Newer wides had better corner performance and were more consistent across the frame.
- Some of the 50mm Flektogons are just awful in the corners.
- The 65mm Flektogons were not great performers in this test, though they had better corner performance than the 50mm Fleks.
- The high-end telephotos were consistently better, both in the corners and in the center, than the Jena Sonnars in this test.
- The Zeiss Planar shared the honors with a Zeiss Oberkochen Sonnar and a (surprise!) Mir 26 45mm wide angle as the best performers at ultimate resolution.
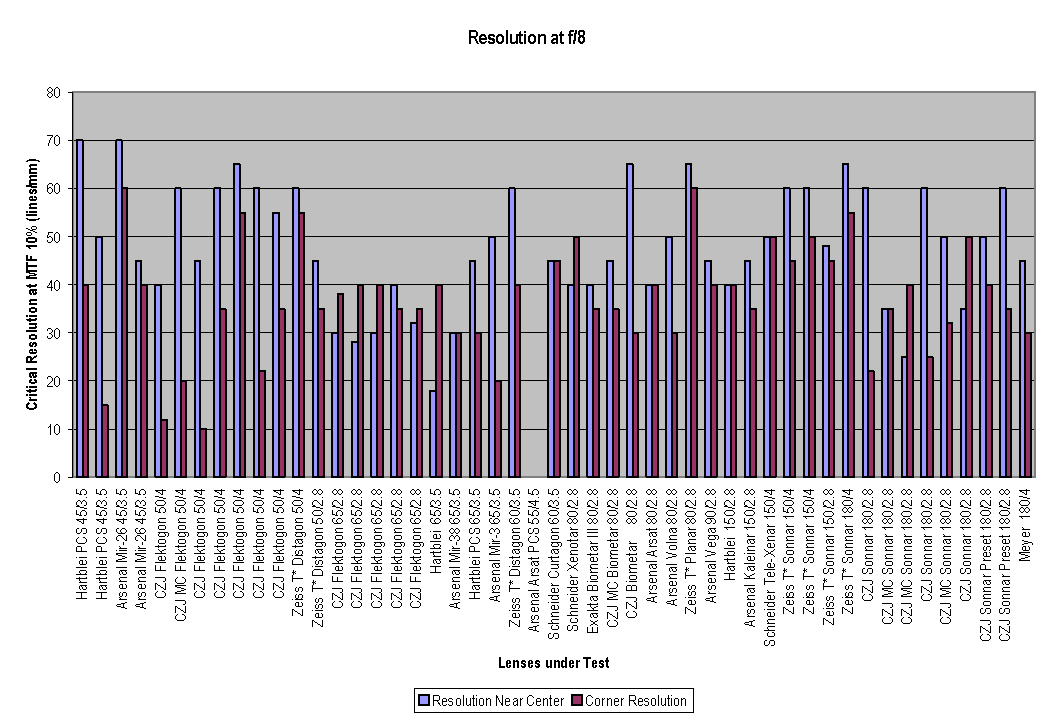
Figure 3. Resolution: Critical Resolution at MTF 10%, f/8.
Wide open, the results are similar to stopped down, but with consistently lower values as expected. Figure 4 shows resolution at maximum aperture. One of the Flektogons was surprisingly good (even if it wasn't that great at MTF 50%), but the resolution king was the Zeiss Oberkochen T* 180/4 lens for the Hasselblad.
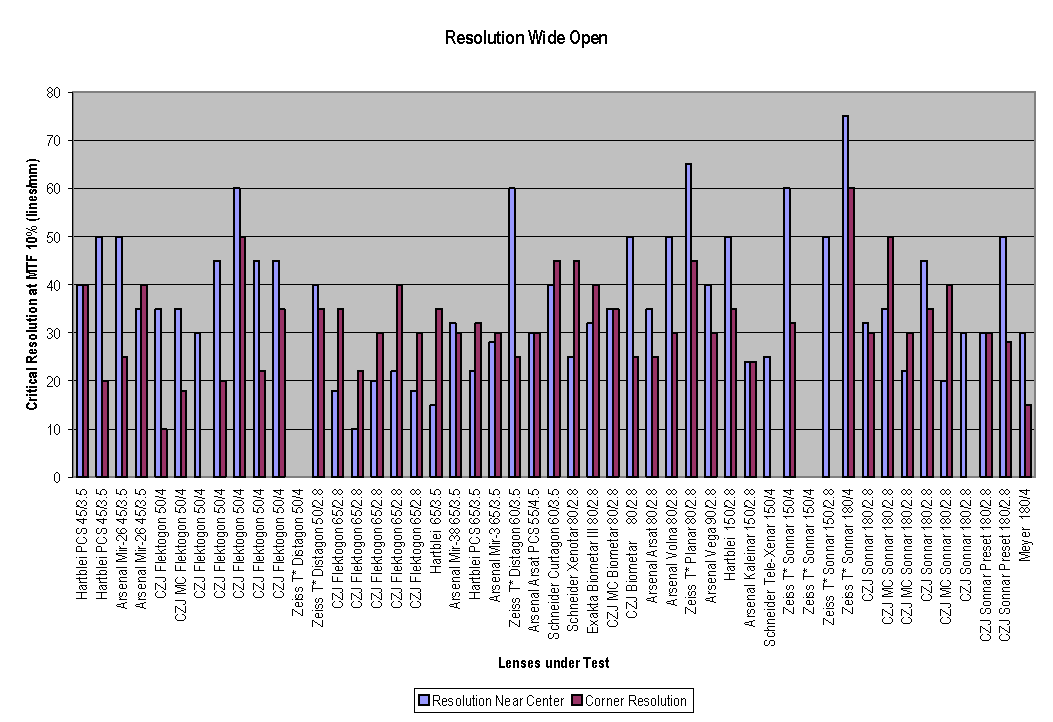
Figure 4. Resolution: Critical Resolution at MTF 10%, Near Maximum Aperture.
Average Performance By Type
One of the objectives of the test was to compare types of lenses. In this test, results are averaged across groups of similar lenses, as shown in Figure 5 for all test protocols. The groups include:
- The Mir 26 variants, including the Hartblei 45mm lenses. There were four lenses in this group.
- The 50mm Flektogons.
- The high-end 50mm Distagons, of which two were included in the test.
- The 65mm Flektogons. These included two that had been multicoated by Hartblei or Arax, though such work was not apparent in the test results.
- Variants on the Biometar, including the Biometar III which was made after the two Zeiss companies were merged.
- High-end telephotos, including the 150mm Zeiss Oberkochen Sonnars and the Schneider Tele-Xenar. This group included four lenses.
- The two Kaleinar variants, including the Hartblei 150.
- The Jena Sonnars, but not including the modified old 1949-design Sonnars.
- The Zeiss Planar, taken as the best all-round performer in the whole test was included as its own category to provide a comparison point.
Results include:
- The 50mm Flektogons were among the best in the center as a class, especially stopped down, and among the worst in the corners.
- The 65mm Flektogons were among the worst in the center of the image.
- The 45mm Mirs were surprisingly good, and as a class better than the 50mm Flektogons
- The high-end teles as a class outperformed the Jena Sonnars as a class.
- The Zeiss Planar does really well in ultimate resolving power, but it was matched by the test lens categories in apparent sharpness. The Biometars were a little better in the center in apparent sharpness, and not quite as good in the corners.
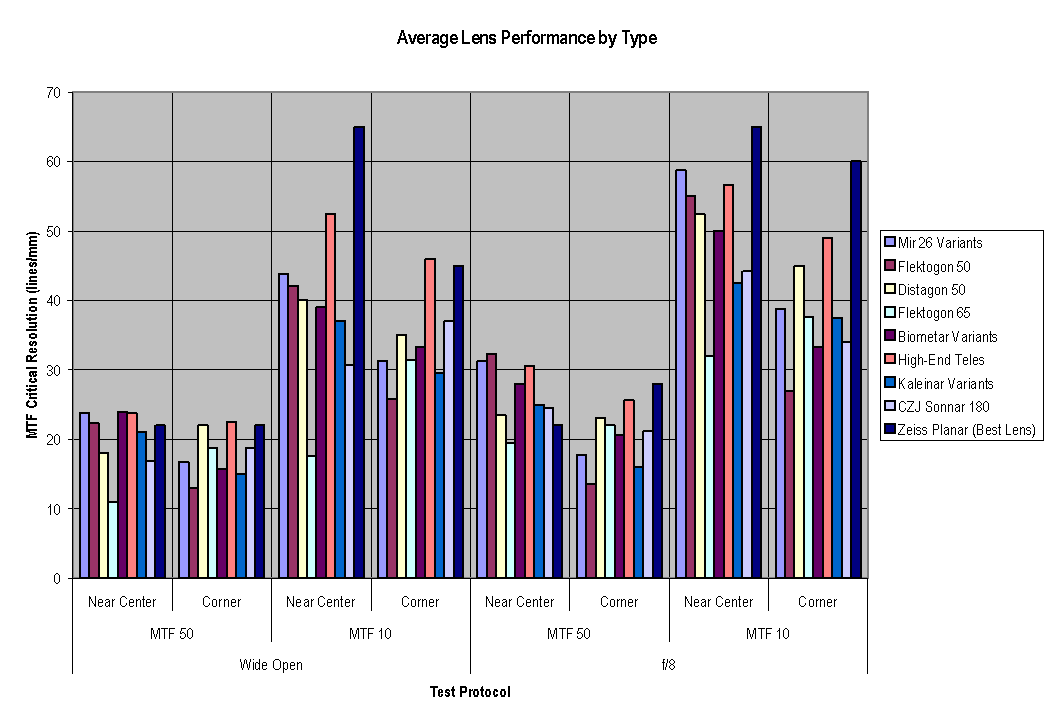
Figure 5. Average Lens Performance, Grouped into Lens Type.
Variability
Any time someone posts images or test results, the chorus tunes up on the theme that sample variation should overwhelm any of these results. Since this test had a good sampling of lenses in each category, we were able to evaluate whether the variability was larger than the general results. Remember that only usably good lenses were included in the test in the first place, so this is a test of the variability of lenses their owners think are worthwhile. That doesn’t mean some of the lenses not represented in the test are better served adding density to a landfill than adding density to a camera bag.
All the variability charts show the average for the class, plus a range of one standard deviation above and below that average. The use of standard deviation rather than high and low extremes from the test is an attempt to filter out outliers and characterize variability more fairly.
From a statistical point of view, if the variability of lenses is normally distributed, and if our small samples represent the distribution of the population, then the range of two standard deviations surrounding the mean will sweep up about 67% of the possibilities. Both of these assumptions are highly questionable, and even the Mother of All Lens Tests doesn’t provide enough data to test them. Thus, there is little that can be drawn that would satisfy statisticians. Generally, if the variability of one class of lenses falls mostly in the range of another class, then we should interpret that as meaning our data doesn’t show much difference. If the variability falls mostly outside the range of another class, then we can reasonably conclude that our samples reveal a difference.
By Type
Figure 6 shows the variability within each class of lens in center contrast. As with the previous charts, this chart probably says the most about how sharp prints made with these lenses will appear in the center of the image.
In terms of apparent sharpness in the center of the image:
- The 50mm Flektogons outperform even the 50mm Distagons, but were similar to the Mirs.
- The Flektogons were indeed more variable than the Mir variants.
- The Jena Sonnars were the most variable of the telephotos in the test.
- The Arsenal 65mm variants were no different as a class than the 65mm Flektogons. Both were, as a class, worse than the strong wides.
- The Biometar variants showed no variability
- The high-end teles were better than the Kaleinar variants or the Jena Sonnars, but not so much as to glow in the dark.
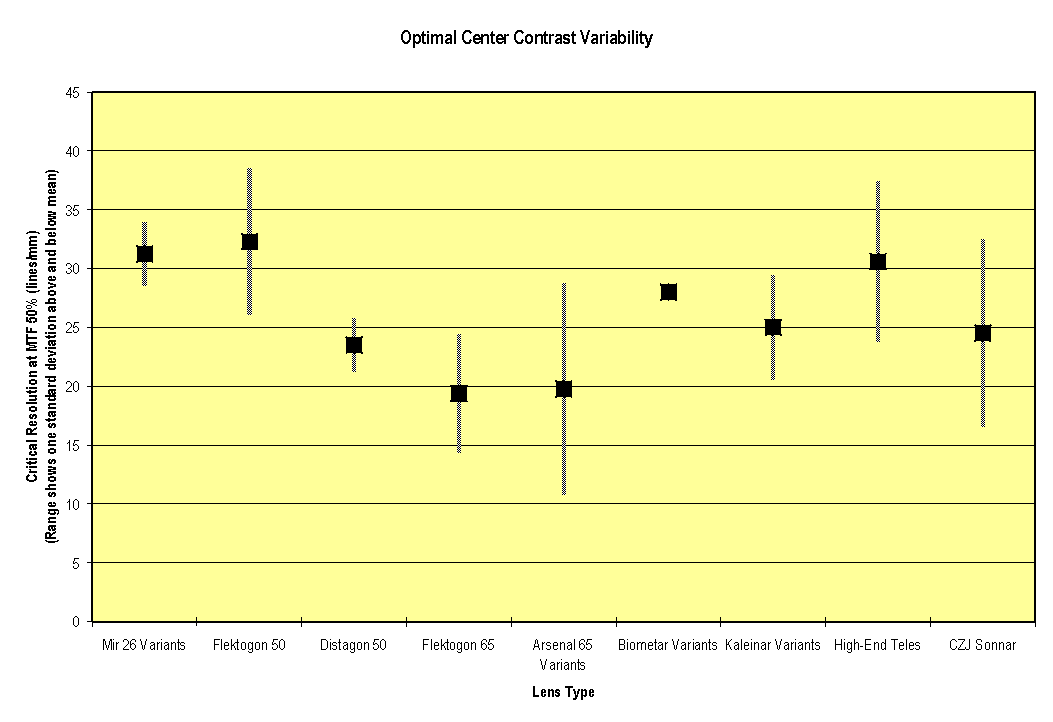
Figure 6. Variability of Optimal Center MTF 50% Performance by Type.
Figure 7 shows the variability of center apparent sharpness wide open. Results were similar to the central contrast stopped down.
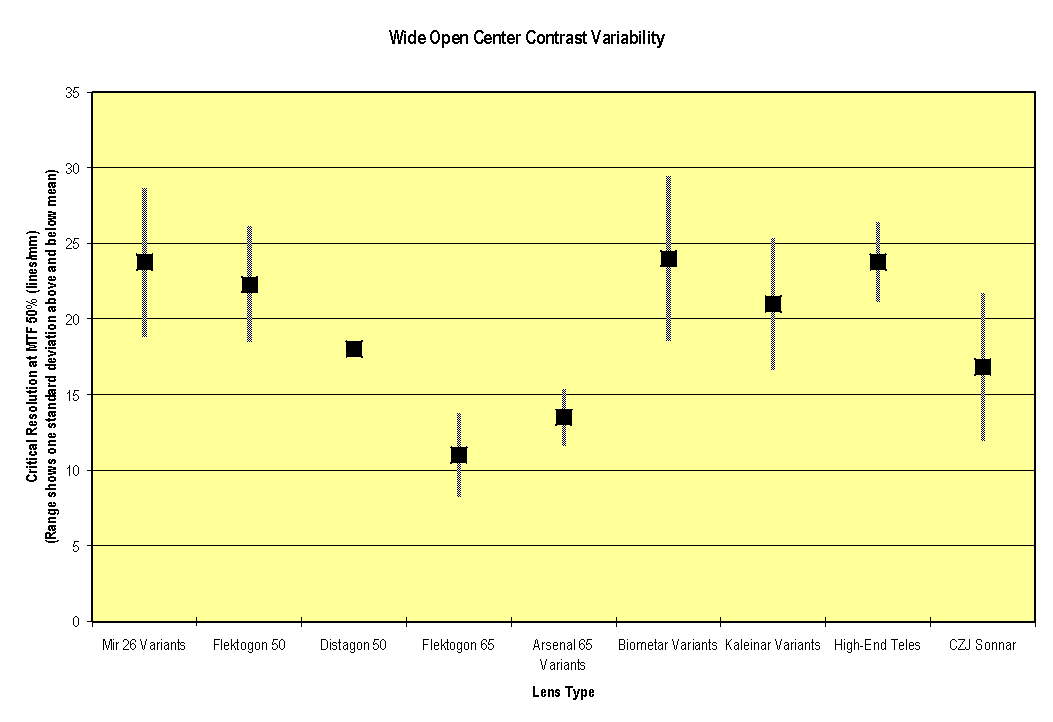
Figure 7. Variability of Wide Open Center MTF 50% Performance by Type.
Figure 8 shows the variability of ultimate resolving power in the center of the frame. Results include:
- The high-end Distagons performed similarly in the center to the Flektogons and Mir 26 variants, with a similar variability.
- In the center of the frame, the 50’s were better than the 65’s.
- The Biometars did quite well in the center.
- The high-end teles outperformed other teles in ultimate resolving power in the center of the frame, but were not that much better than the Jena Sonnars.
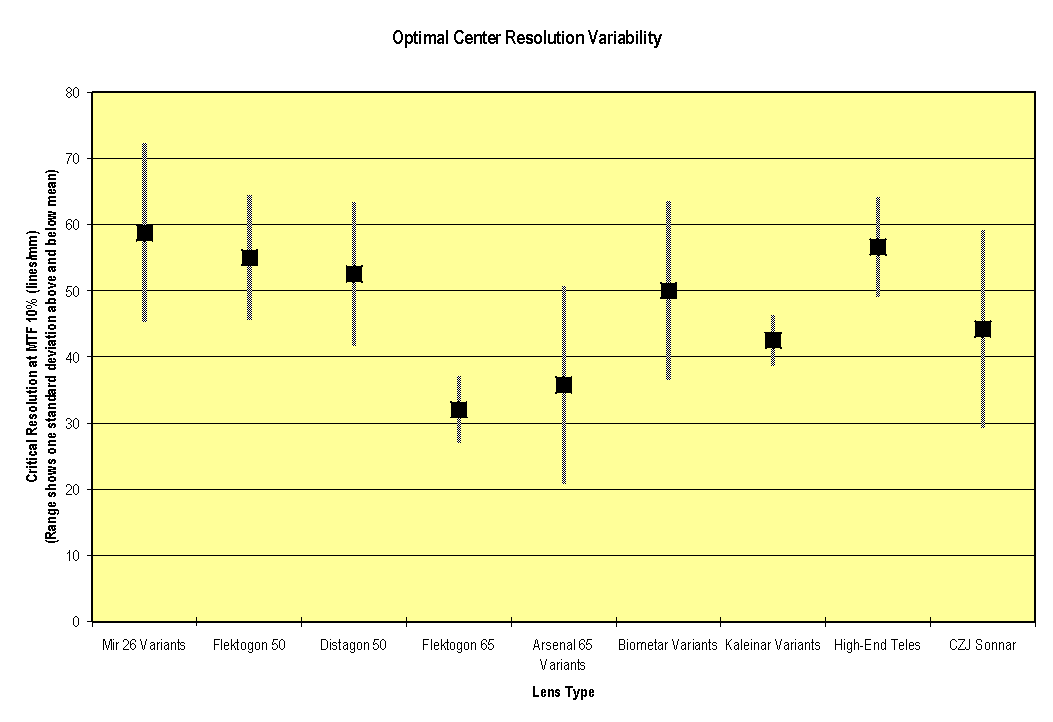
Figure 8. Variability of Ultimate Center Resolving Power.
Just for completeness, Figure 9 shows the variability of corner ultimate resolving power at f/8. The only noteworthy result is that variability in corner performance is far greater in strong wide-angle lenses than in normal and telephoto lenses. The high-end strong wides were no exception, either.
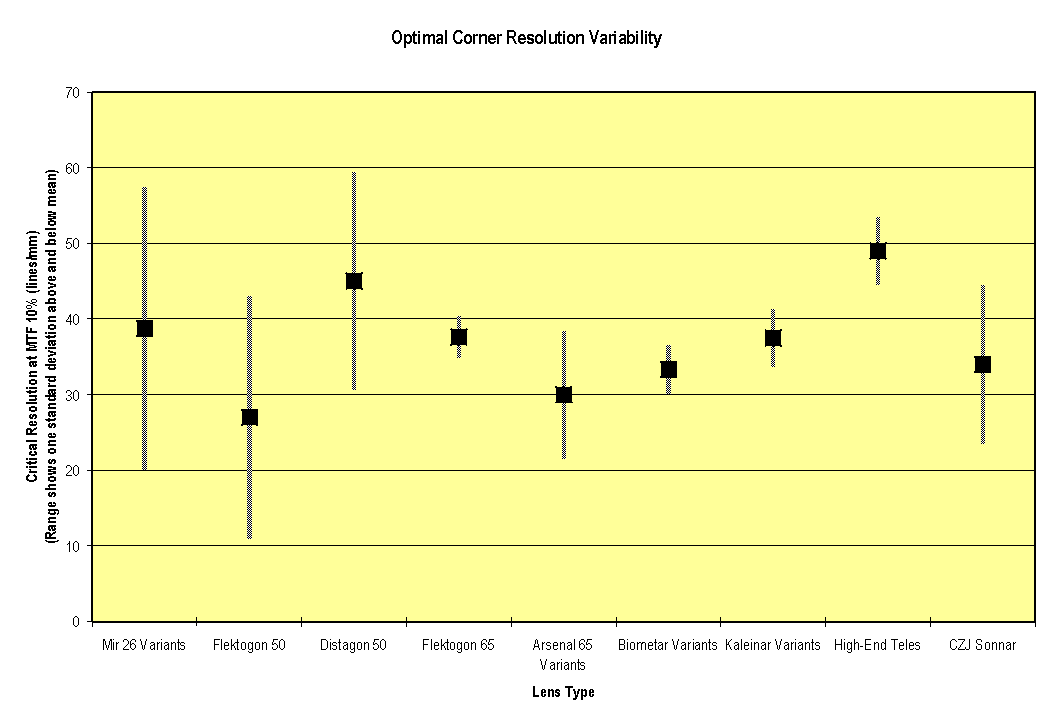
Figure 9. Variability of Ultimate Corner Resolving Power.
By Production Year
Finally, one old myth has it that Zeiss Jena did better work in the early years than in later years. We have heard many stories that Jena technicians had sunk so low in terms of morale, and were scrounging for parts in the later years, that I included a test to determine if production year was in any way correlated with lens performance. Those correlations are shown in Figure 10.
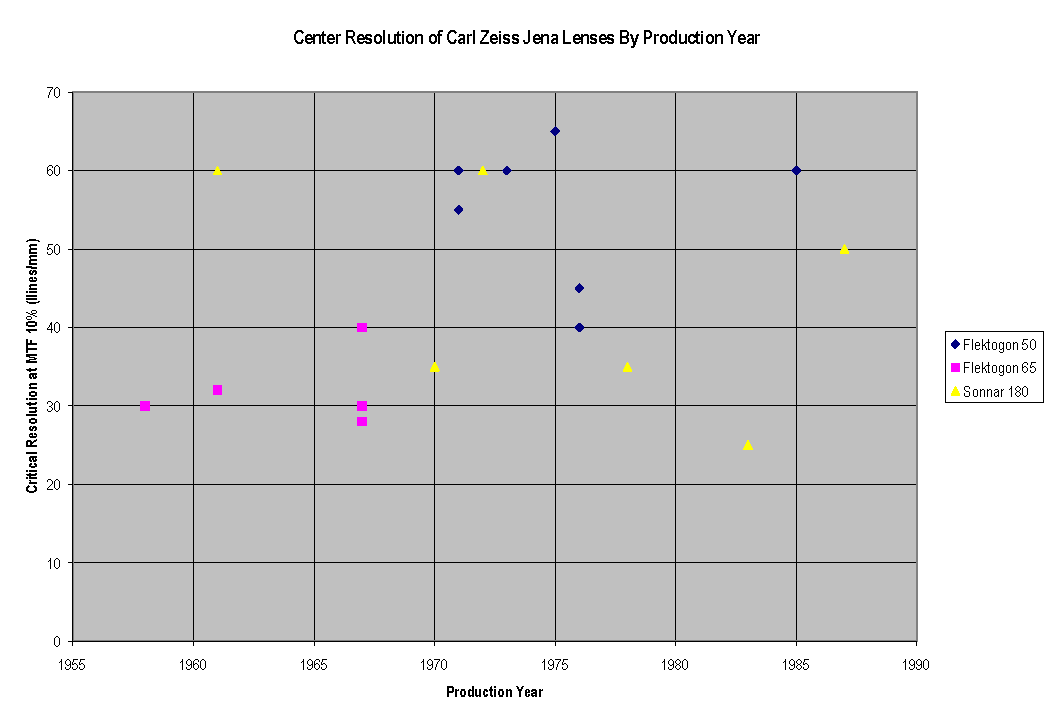
Figure 10. Center Resolution by Production Year.
All the 65mm Flektogons are old, and two of them had been multicoated and reworked in recent years. The Jena Sonnars ranged in production from 1961 to 1987. And so on. But it didn’t matter; there is no correlation at all between production year and ultimate center resolving power.
As Figure 11 shows, there is also no correlation between production year and apparent central sharpness or contrast.
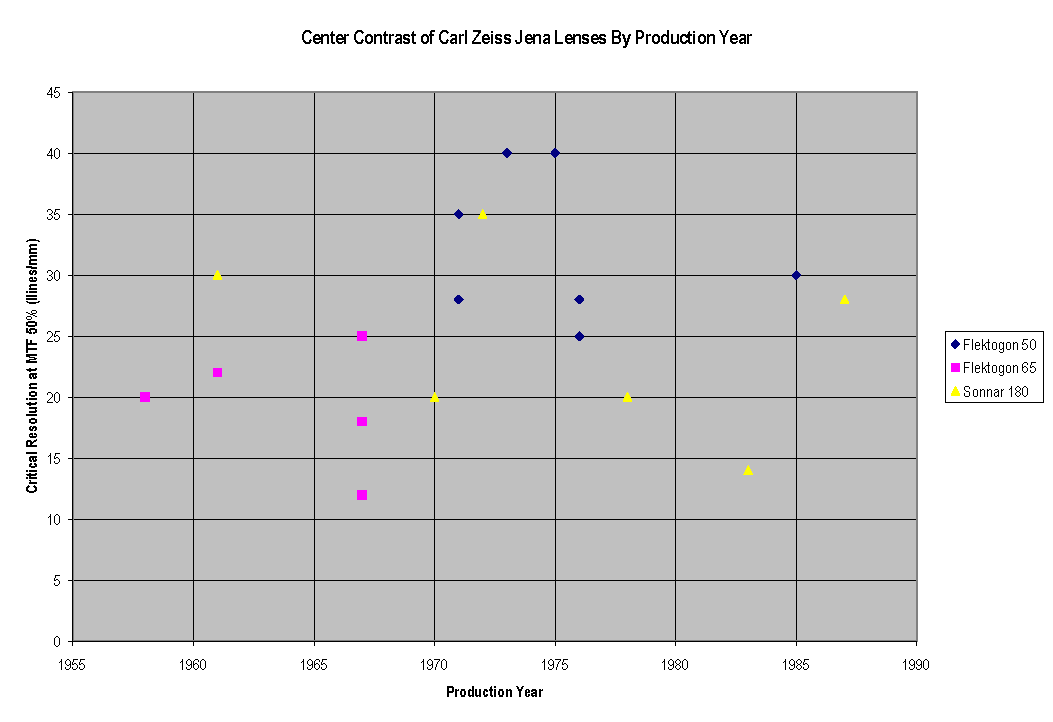
Figure 11. Center Contrast by Production Year.
Comparison of Eastern-Bloc Lenses with Western High-End Lenses
One of the objectives of the test was to compare lenses from the Second World to lenses from the First World. To illustrate this comparison, Figure 12 shows average performance of various lens groups compared with an acknowledged first-quality lens or group of lenses. The 45mm Mir-26 variants and the 50mm Flektogons were compared with 50mm Distagons as a group. The 65mm Ukrainian and East German lens groups were compared with the Schneider Curtagon 60mm lens. The 80mm Biometars as a group were compared with the 80mm Zeiss T* Planar for the Hasselblad. The Kaleinar and CZJ Sonnar groups were compared with the Zeiss Oberkochen and Schneider teles as a group.
Figure 12 also demonstrates some design strategies on the part of the designers. Clearly, the design objective of Zeiss Jena in wide-angle lenses was to produce excellent center performance at the expense of corner performance, while the objective of later western designers was to provide more even performance across the frame. This effect is visible with the strong wide-angle lenses, both the Ukrainian Mir-26 variants and the Zeiss Jena Flektogon 50mm lenses.
The 65's did not measure up to western lenses, as represented by the Schneider Curtagon. They did better with respect to the Schneider Curtagon at MTF 50 than at MTF 10, and thus were probably optimized more for contrast than ultimate resolution.
The Eastern-Bloc telephotos were also not up to the standard of the western telephotos, as we have seen before. But they are more even in comparison with them, reflecting no significant difference in design objective.
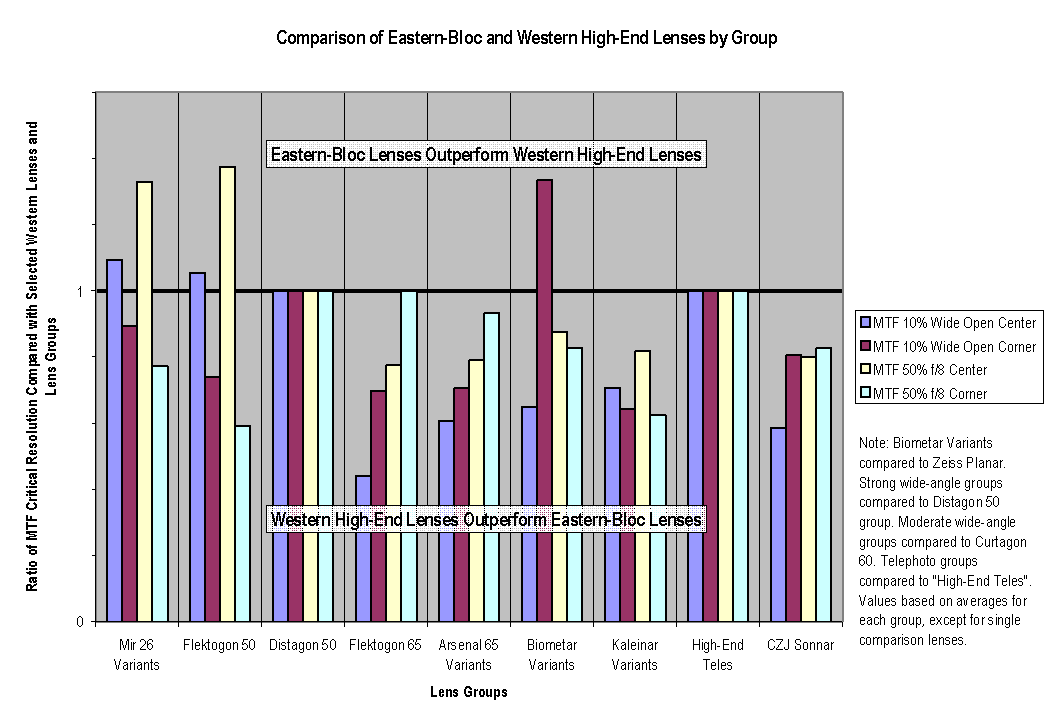
Figure 12. Comparison of Eastern-Bloc lenses with western high-end lenses.
Subjective Testing
Stay Tuned. This section will be completed once the images are scanned and evaluated.